Widely known for their ability to incorporate volatility and capture price action, Bollinger bands have been a favorite staple of traders in the FX market. However, there are other technical options that traders in the currency markets can apply to capture profitable opportunities in swing action. Lesser-known band indicators such as Donchian channels, Keltner channels and STARC bands are all used to isolate such opportunities. Also used in the futures and options markets, these technical indicators have a lot to offer given the vast liquidity and technical nature of the FX forum. Differing in underlying calculations and interpretations, each study is unique because it highlights different components of the price action. Here we explain how Donchian channels, Keltner channels and STARC bands work and how you can use them to your advantage in the FX market.
Donchian Channels
Donchian channels are price channel studies that are available on most charting packages and can be profitably applied by both novice and expert traders. Although the application was intended mostly for the commodity futures market, these channels can also be widely used in the FX market to capture short-term bursts or longer-term trends. Created by Richard Donchian, considered to be the father of successful trend following, the study contains the underlying currency fluctuations and aims to place profitable entries upon the start of a new trend through penetration of either the lower or upper band. Based on a 20-period moving average (and thus sometimes referred to as a moving average indicator), the application additionally establishes bands that plot the highest high and lowest low. As a result, the following signals are produced:
A buy, or long, signal is created when the price action breaks through and closes above the upper band.
A sell, or short, signal is created when the price action breaks though and closes below the lower band.
The theory behind the signals may seem a little confusing at first, as most traders assume that a break of the upper or lower boundary signals a reversal, but it is actually quite simple. If the current price action is able to surpass the range's high (provided enough momentum exists), then a new high will be established because an uptrend is ensuing. Conversely, if the price action can crash through the range's low, a new downtrend may be in the works. Let's look at a prime example of how this theory works in the FX markets.
Figure 1 - A typical example of the effectiveness of Donchian channels
Often in life, the right action is the hardest to take. The same dynamic occurs in trading. For most traders it is extremely difficult to buy tops and sell bottoms because from a very early age we are conditioned to look for value and buy "cheap" while selling "dear". This is why although most traders proclaim their love for trading with the trend, in reality, the majority love to pick tops or bottoms. While these types of "turn" trades can be very profitable, turn trading can sometimes seem like a Sisyphean task as price trends relentlessly in one direction, constantly stopping out the bottom and top pickers.
Most traders are reluctant to buy breakouts for fear of being the last one to the party before prices reverse with a vengeance. So, how can they learn to trade breakouts confidently and successfully? The "do the right thing" setup is designed to deal with just such a predicament. It tells the trader to buy or sell when most ingrained lessons are against doing so. Furthermore, it puts the trader on the right side of the trend at the times when many other traders are trying to fade the price action. Read on as we cover this strategy and show you some examples of how it can be used.
Do the Right Thing - Trade Breakouts In the "do the right thing" strategy, the capitulation of top and bottom pickers in the face of a massive buildup of momentum forces a covering of positions, allowing you to exit profitably within a very short period of time after putting on a trade.
"Do the right thing" employs a rarely used indicator in FX called the commodity channel index (CCI), which was invented by Donald Lambert in 1980 and was originally designed to solve engineering problems regarding signals. The primary focus of CCI is to measure the deviation of the price of the currency pair from its statistical average. As such, CCI is an extremely good and sensitive measure of momentum and helps us to optimize only the highest probability entries for our setup.
Without resorting to the mathematics of the indicator, please note that CCI is an unbound oscillator with a reading of +100 typically considered to be overbought and any reading of -100 is considered oversold. For our purposes, however, we will use these levels as our trigger points as we put a twist on the traditional interpretation of CCI. We actually look to buy if the currency pair makes a new high above 100 and sell if the currency pair makes a new low below -100. In "do the right thing" we are looking for new peaks or spikes in momentum that are likely to carry the currency pair higher or lower. The thesis behind this setup is that much like a body in motion will remain so until it's slowed by counterforces, new highs or lows in CCI will propel the currency farther in the direction of the move before new prices finally put a halt to the advance or the decline.
Rules for the Long Trade
On the daily or the hourly charts, place the CCI indicator with standard input of 20.
Note the very last time the CCI registered a reading of greater than +100 before dropping back below the +100 zone.
Take a measure of the peak CCI reading and record it.
If CCI once again trades above the +100 and if its value exceeds the prior peak reading, go long at market at the close of the candle.
Measure the low of the candle and use it as your stop.
If the position moves in your favor by the amount of your original stop, sell half and move the stop to breakeven.
Take profit on the rest of the trade when the position moves to two times your stop.
Rules for the Short Trade
On the daily or the hourly charts, place the CCI indicator with standard input of 20.
Note the very last time the CCI registered a reading of less than -100 before poking above the -100 zone.
Take a measure of the peak CCI reading and record it.
If CCI once again trades below the -100 and if its value exceeds the prior low reading, go short at market at the close of the candle.
Measure the high of the candle and use it as your stop.
If the position moves in your favor by the amount of your original stop, sell half and move the stop on the remainder of the position to breakeven.
Take profit on the rest of the trade when position moves to two times your stop.
CCI Setup On Longer Time Frames In the daily chart of the EUR/USD pair (Figure 1) we see that the former peak high above the CCI +100 level was recorded on September 5, 2005, when it reached a reading of 130. Not until more than three months later on December 13, 2005, did the CCI produce a value that would exceed this number.
Throughout this time, we can see that EUR/USD was in a severe decline with many false breakouts to the upside that fizzled as soon as they appeared on the chart. On December 13, 2005, however, CCI hit 162.61 and we immediately went long on the close at 1.1945 using the low of the candle at 1.1906 as our stop. Our first target was 100% of our risk, or approximately 40 points. We exited half the position at 1.1985 and the second half of the position at two times our risk at 1.2035. Our total reward-to-risk ratio on this trade was 1.5:1, which means that if we are only 50% accurate, the setup would still have positive expectancy. Note also that we were able to capture our gains in less than 24 hours as the momentum of the move carried our position to profit very quickly.
Figure 1: Do the Right Thing CCI Trade, EUR/USD
Source: FXtrekIntellichart
For traders who do not like to wait nearly a quarter of a year between setups, the hourly chart offers far more opportunities for the "do the right thing" setup. It is still infrequent, which is one of the reasons that makes this setup so powerful (the common wisdom in trading is "the rarer the trade, the better the trade"). Nevertheless, it occurs on the hourly charts far more often than on the dailies.
In Figure 2, we look at the hourly chart of the EUR/USD between March 24 and March 28 of 2006. At 1pm on March 24, the EUR/USD reaches a CCI peak of 142.96. Several days later at 4am on March 28, the CCI reading reaches a new high of 184.72. We go long at market on the close of the candle at 1.2063. The low of the candle is 1.2027 and we set our stop there.
The pair consolidates for several hours and then makes a burst to our first target of 1.2103 at 9am on March 28. We move the stop to breakeven to protect our profits and are stopped out a few hours later, banking 40 pips of profit. As the saying goes, half a loaf is better than none, and it is amazing how they can add up to a whole bakery full of profits if we simply take what the market gives us.
Figure 2: Do the Right Thing CCI Trade, EUR/USD
Source: FXtrekIntellichart
CCI Setup On Shorter Time Frames Figure 3 shows a short in the USD/CHF. This example is the opposite of the approach shown above. On October 11, 2004, USD/CHF makes a CCI low of -131.05. A few days later, on October 14, the CCI prints at -133.68. We enter short at market on the close of the candle at 1.2445. Our stop is the high of that candle at 1.2545. Our first exit is hit just two days later at 1.2345. We stay in the trade with the rest of the position and move the stop to breakeven. Our second target is hit on October 19 - no more than five days after we've entered the trade.
The total profit on the trade? 300 points. Our total risk was only 200 points, and we never even experienced any serious drawdown as the momentum pulled prices farther down. The key is high probability, and that is exactly what the "do the right thing" setup provides.
Figure 3: Do the Right Thing CCI Trade, USD/CHF
Source: FXtrekIntellichart
Figure 4 shows another example of a short-term trade, this time to the downside in the EUR/JPY. At 9pm on March 21, 2006, EUR/JPY recorded a reading of -115.19 before recovering above the -100 CCI zone. The "do the right thing" setup triggered almost perfectly five days later, at 8pm on March 26. The CCI value reached a low of -133.68 and we went short on the close of the candle. This was a very large candle on the hourly charts, and we had to risk 74 points as our entry was 140.79 and our stop was at 141.51.
Many traders would have been afraid to enter short at that time, thinking that most of the selling had been done, but we had faith in our strategy and followed the setup. Prices then consolidated a bit and trended lower until 1pm on March 27. Less than 24 hours later we were able to hit our first target, which was a very substantial 74 points. Again we moved our stop to breakeven. The pair proceeded to bottom out and rally, taking us out at breakeven. Although we did not achieve our second target overall, it was a good trade as we banked 74 points without ever really being in a significant drawdown.
Figure 4: Do the Right Thing CCI Trade, EUR/JPY
Source: FXtrekIntellichart
When "Do the Right Thing" Does You Wrong
Figure 5 shows how this setup can go wrong and why it is critical to always use stops. The "do the right thing" setup relies on momentum to generate profits. When the momentum fails to materialize, it signals that a turn may be in the making. Here is how it played out on the hourly charts in AUD/USD. We note that CCI makes a near-term peak at 132.58 at 10pm on May 2, 2006. A few days later at 11am on May 4, CCI reaches 149.44 prompting a long entry at .7721. The stop is placed at .7709 and is taken out the very same hour. Notice that instead of rallying higher, the pair reversed rapidly. Furthermore, as the downside move gained speed, prices reached a low of .7675. A trader who did not take the 12-point stop as prescribed by the setup would have learned a very expensive lesson indeed as his losses could have been magnified by a factor of three. Therefore, the key idea to remember with our "do the right thing" setup is - "I am right or I am out!"
Figure 5: Do the Right Thing CCI Trade, AUD/USD
Source: FXtrekIntellichart
Conclusion "Do the right thing" allows traders to trade breakouts confidently and successfully. CCI can put you on the right side of a trade when many others are trying to fade the price action. However, this setup only works if you apply it along with disciplined stops to protect you from major losses if the expected momentum fails to materialize.
by Kathy Lien and Boris Schlossberg,
Boris Schlossberg runs BKTraderFX, a forex advisory service and is the senior currency strategist at Forex Capital Markets in New York, one of the largest retail forex market makers in the world. He is a frequent commentator for Bloomberg, Reuters, CNBC and Dow Jones CBS Marketwatch. His book, "Millionaire Traders" (John Wiley and Sons) is available on Amazon.com, where he also hosts a blog on all things trading.
Kathy Lien is Chief Strategist at the world's largest retail forex market maker, Forex Capital Markets in New York. Her book "Day Trading the Currency Market: Technical and Fundamental Strategies to Profit from Market Swings" (2005, Wiley), written for both the novice and expert, has won much acclaim. Easy to read and easy to apply, this book shows traders how to enter the currency market with confidence - and create long-term success! Kathy has taught currency trading seminars across the U.S. and has also written for CBS MarketWatch, Active Trader, Futures Magazine and SFO Magazine. Follow her blog at www.kathylien.com
For years, market aficionados and forex traders alike have been using simple price patterns not only to forecast profitable trading opportunities but also to explain simple market dynamics. As a result, common formations such as pennants flags and double bottoms and tops are often used in the currency markets, as well as many other trading markets. A less talked about, but equally useful, pattern that occurs in the currency markets is the bearish diamond top formation, commonly known as the diamond top. In this article, we'll explain how forex traders can quickly identify diamond tops in order to capitalize on various opportunities.
The diamond top occurs mostly at the top of considerable uptrends. It effectively signals impending shortfalls and retracements with relative accuracy and ease. Because of the increased liquidity of the currency market, this formation can be easier to identify in the currency market than in its equity-based counterpart, where gaps in price action frequently occur, displacing some of the requirements needed to recognize the diamond top. This formation can also be applied to any time frame, especially daily and hourly charts, as the wide swings often seen in the currency markets will offer traders plenty of opportunities to trade.
Identifying and Trading the Formation The diamond top formation is established by first isolating an off-center head and shoulders formation and applying trendlines dependent on the subsequent peaks and troughs. It gets its name from the fact that the pattern bears a striking resemblance to a four-sided diamond.
Let's look at a step-by-step breakdown of how to trade the formation, using the Australian dollar/U.S. dollar (AUD/USD) currency pair (Figure 1) as our example. First, we identify an off-center head and shoulders formation in a currency pair. Next, we draw resistance trendlines, first from the left shoulder to the head (line A) and then from the head to the right shoulder (line B). This forms the top of the formation; as a result, the price action should not break above the upper trendline resistance formed by the right shoulder. The idea is that the price action consolidates before the impending shortfall, and any penetrations above the trendline would ultimately make the pattern ineffective, as it would mean that a new peak has been created. As a result, the trader would be forced to consider either reapplying the trendline (line B) that runs from the head to the right shoulder, or disregarding the diamond top formation altogether, since the pattern has been broken.
To establish lower trendline support, the technician will simply eye the lowest trough established in the formation. Bottomside support can then be drawn by connecting the bottom tail to the left shoulder (line C) and then connecting another support trendline from the tail to the right shoulder (line D). This connects the bottom half to the top and completes the pattern. Notice how the rightmost angle of the formation also resembles the apex of a symmetrical triangle pattern and is suggestive of a breakout.
Figure 1 - Identifying a diamond top formation using the AUD/USD.
Trading the diamond top isn't much harder than trading other formations. Here, the trader is simply looking for a break of the lower support line, suggesting increasing momentum for a probable shortfall. The theory is quite simple. Both upper resistance and lower support levels established by the right shoulder will contain the price action as each subsequent session's range diminishes, suggestive of a near-term breakout. Once a session closes below the support level, this indicates that selling momentum will continue because sellers have finally pushed the close below this significant mark. The trader will then want to place his/her entry shortly below this level to capture the subsequent decline in the price. This approach works especially well in the currency markets, where price action tends to be more fluid and trends are established more quickly once a certain significant support or resistance level is broken. Money management would be applied to this position through a stop-loss placed slightly above the previously broken support level to minimize any losses that might occur if the break is false and a temporary retracement takes place.
Figure 2 below shows a zoomed in view of Figure 1. We can see that a session candle closed below or "broke" the support trendline (line D.i.), indicating a move lower. The diamond top trader would profit from this by placing an entry order below the close of the support line at 0.7504, while also placing a stop-loss slightly above the same line to minimize any potential losses should the price bounce back above. The standard stop will be placed 50 pips higher at 0.7554. In our example, the stop order would not have been executed because the price did not bounce back, instead falling 150 pips lower in one session before falling even further later on.
Figure 2 - A closer look at the diamond top formation using the AUD/USD. Notice how the position of the entry is just below the support line (D.i.).
Finally, profit targets are calculated by taking the width of the formation from the head of the formation (the highest price) to the bottom of the tail (the lowest price). Staying with our example using the AUD/USD currency pair, Figure 3 shows how this would be done. In Figure 3, the AUD/USD exchange rate at the top of the formation is 0.8003. The bottom of the diamond top is exactly 0.7250. This leaves 753 pips between the two prices that we use to form the maximum price where we can take profits. To be safe, the trader will set two targets in which to take profits. The first target will require taking the full amount, 753 pips, and taking half that amount and subtracting it from our entry price. Then, the first target will be 0.7128. The price target that will maximize our profits will be 0.6751, calculated by subtracting the full 753 pips from the entry price.
Figure 3 - The price target is calculated on the same example of the AUD/USD
Using a Price Oscillator Helps One of the cardinal rules of successful trading is to always receive confirmation, and the diamond top pattern is no different. Adding a price oscillator such as moving average convergence divergence and the relative strength index can increase the accuracy of your trade, since tools like these can gauge price action momentum and be used to confirm the break of support or resistance. Applying the stochastic oscillator to our example (Figure 4), the investor confirms the break below support through the downward cross that occurs in the price oscillator (point X).
Figure 4 - The cross of the stochastic momentum indicator (point X) is used to confirm the downward move.
Putting It All Together Not only do bearish diamond tops form in the major currency pairs like the Euro/U.S. dollar (EUR/USD), the British pound/U.S. dollar (GBP/USD) and the U.S. dollar/Japanese yen (USD/JPY), but they also form in lesser-known cross-currency pairs such as the Euro/Japanese yen (EUR/JPY). Although the formation occurs less in the cross-currency pairs, the swings tend to last longer, creating more profits. Let's look at a step-by-step example of this using the EUR/JPY:
1) Identify the head and shoulders pattern and confirm the offset nature of the formation by noticing that the head is slightly to the left, while the tail is set to the right.
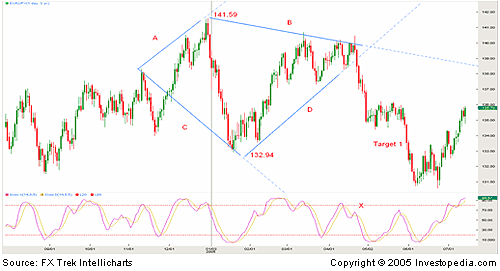
2) Form the top resistance by connecting the left shoulder to the tip top of the head (line A) and the head to the right shoulder (line B). Next, draw the trendlines for support by connecting the left shoulder (line C) to the tail and the tail to the right shoulder (line D).
3) Calculate the width of the formation by taking the prices at the top of the head, 141.59, and the bottom of the tail, 132.94. This will give us a total of 865 pips of distance before we can take our full profits. Divide by two and our first point to take profits will be 432 pips below our entry.
4) Establish the entry point. Look to the apex of the right shoulder and notice the point where the candle closes below the support line, breaking through. Here, the close of the session is 137.79. The entry order should then be placed 50 pips below at 137.29, while our stop-loss order will be placed 50 pips above at 137.79.
5) Calculate the first take profit price by subtracting 432 pips from the entry. As a result, the first profit target will be at 133.45.
6) Finally, confirm the trade by using a price oscillator. Here, the stochastic oscillator signals ahead and confirms the opportunity as it breaks below overbought levels (point X).
If the first target is achieved, the trader will move his/her stop up to the first target, then place a trailing stop to protect any further profits.
Figure 5 - A different example of a diamond top formation using the EUR/JPY cross-currency pair. This chart shows all the trendlines, the highest and the lowest price, and the price target.
Conclusion
Although the bearish diamond top has been overlooked due to its infrequency, it remains very effective in displaying potential opportunities in the forex market. Smoother price action due to the enormous liquidity of the market offers traders a better context in which to apply this method and isolate better opportunities. When this formation is combined with a price oscillator, the trade becomes an even better catch - the price oscillator enhances the overall likelihood of a profitable trade by gauging price momentum and confirming weakness as well as weeding out false breakout/breakdown trades.
Richard Lee is a currency strategist at Forex Capital Markets LLC. Employing both fundamental models and technical analysis applications, Richard contributes regularly to DailyFX and Bloomberg. He has extensive experience in trading the spot currency markets, options and futures. Before joining the research group, Richard traded FX, equity and equity derivatives for a private equity consortium. Richard graduated from Pennsylvania State University with a Bachelor of Arts in economics and a Bachelor of Science in French with an emphasis in international business.
This is purely opinion, but as you look at the pattern construction there are two key elements to the success of this pattern.
Let’s put it in the context of a Bullish Gartley Pattern:
A) You are trading with the overall trend. Note that the move from X to A is a large move up, and that the move against the trend from A to D is counter to that of the XA move, but is contained within XA so the trend up is not broken. In fact, in Elliott Wave world the translation of this pattern is that we have one Impulse wave up from X to A, then three corrective moves to the downside (AB, BC, and CD). The conclusion then from Elliott Wave would be the likelihood for another impulse wave to the upside.
B) Secondly, the reason this pattern is successful is that it is a bit of a “trap.” Let’s look at this step by step from swing point A.
a. After establishing swing point A price drops down to B and forms a swing low. Psychologically traders see this as a defining point and start to accumulate positions on the long side.
b. As price climbs and forms a swing high C the positions are established and many stops are placed under the swing low B point. In fact, short sellers are even starting to look at this swing B point as a potential area to short if price comes back down.
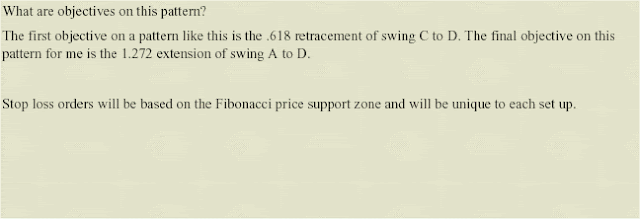
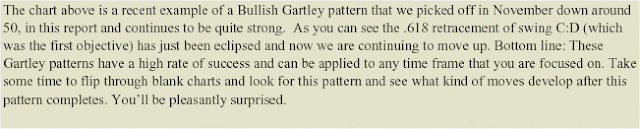
c. As the pattern plays out and price starts coming down from swing high C, the longs are getting nervous and the shorts and sitting in the background ready to pounce. Then Whammo! Price goes below the swing low B and all of a sudden the weak long traders start selling and the short players begin to sell ‘em creating additional momentum to the downside that ultimately takes us down to ideally around the .786 retracement of swing XA. This is a defining point for the stock/commodity. This is where the Gartley pattern screams to look for opportunity to buy…why? Partly due to the fact that you are psychologically going against the market at this point.
d. If swing D holds above X and price starts to creep up traders get a little uptight. Then as price goes back above swing low point B the weak short players cover and the longs that got shook out come back in and you’re long position is enjoying the ride from this psychological shake out.
So, to conclude, the pattern has been successful for so many years, in my opinion because it trades WITH the trend (in the context of the XA move), AND it capitalizes on the psychological aspects of traders. This is a pattern that I think every trader should be aware of and in many cases should incorporate into their trading plan.Derrik Hobbs
In this article we look at preparation, techniques and money management for using integrated pitchfork analysis.
Spotting the Trade Opportunity
The process of low-risk high-probability spotting trades is very systematized for the experienced trader. He/she should visually scan the various choices of the operational time frame charts: 60-min, 30-min, 15-min and less frequently the 5-min chart. Our goal is to detect candidates representing low-risk high-probability trades. Once these opportunities revealed, we will employ different techniques with all the recommended disciplined rigour and patience. One of these is the zoom-and-retest technique, which is applied to a German Dax up-sloping failure.
Finding the Optimal Set-Up
In this trade, we have spotted triple up-sloping failures on 60-min, 30-min and 15-min operational charts (refer to Figures 1, 2 and 3). We have chosen the 60-min chart (refer to Figure 4), as our optimal operational trading time frame, because of the better trend visualisation, longer running profit and less market noise. The risk might be slightly higher but the profit, like I said, much more consistent.
Time Frame Alignment
We have noted that the upper time frames (weekly and daily charts) are both in the same up-sloping direction, but ready to be corrected. Then, we have looked at the three lower time frames (60-, 30- and 15-min) to observe the local market movements, and to better pinpoint our entry. We notice that the corrections of the three up-sloping trends, on theses charts have already started. The 5169 level pivot is common for all the studied time frames: weekly, daily (both charts not shown), 60-min, 30-min and 15-min charts.
The above 60-min chart illustrates the beginning of a correction with a big down-bar, closing right on the Center Line of the Action/Reaction lines set-up. The triple mirror pattern at the highest high (5169 level) is the guarantor of the reversal, beginning of a correction. It is highly probable that the down move will continue, at least a few bars, with intense momentum.
The above 30-min chart illustrates the beginning of a correction. The market travelled for a 6-bar duration on the lower median line, through a very narrow ascending channel, being halted cold at the 5169 resistance level. Then, it dropped with a big down-bar; very close to the external lower 150% Fibonacci line. The triple mirror pattern at the highest high is the guarantor of the reversal, beginning of a significant correction. It is highly probable that the down move will continue, at least for a few bars, with high-steamed momentum.
The above 15-min chart illustrates the beginning of a correction. The very strong market travelled almost vertically, made an eight bar narrow range consolidation below the 5169 level. Then, it dropped with a big down-bar, almost freely. The triple top pattern at the highest high is the guarantor of the reversal, beginning of a significant correction. It is highly probable that the down move will continue, for at least a few bars, with the same vigorous momentum.
Three Pawn Technique – Triple Order Preparation and Trade Execution
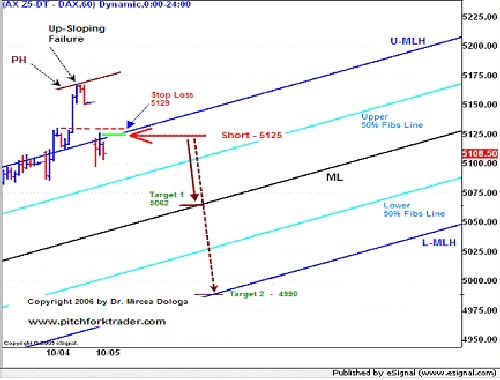
By observing the Figure 4, we note that the down move continues strongly, as anticipated, and created a down-gap, zooming through the upper median line of the ascending pitchfork. Now that the zoom is accomplished, let us consider the following trade, in case of a test or retest of the upper median line (U-MLH):
Sell stop entry at 5125 – if test or retest, after zooming move,
Initial stop loss - buy stop at 5129 - just above the last high of the previous trend,
First profit target objective (target No 1) – buy stop at 5062 - at the confluence of the market price with the median line (ML).
Second profit target objective (target No 2) – buy stop at 4990 - at the intersection of the market price with the lower median line (L-MLH). The value of this target has been calculated using the ATRs technique.
Due to the size and the location of the gap, which is probably a breakout gap, it seems that the trade has a high probability potential. Thus, we will consider, two trading units:
First that will be exited at the target No 1 level, and
The second that will be exited at the target No 2 level. Who knows, we might be able to get a free ride and trade with the market’s own money.
But before placing any orders, we will have to establish the reward/risk ratio, and verify if the R/R ratio value is above/below our 2.5 usual limit.
Let us proceed and calculate the reward/risk ratio (R/R ratio), for this low-risk high-probability short trade. The calculation per contract will be only done until the target n°1. For the target n°2 there will be no risk because as soon as the target n°1 is attained, we will move the stop loss to the break-even point at 5125 level:
Reward is 63 Dax points for target No 1, [entry level (5125) minus target n°1 level (5062)],
Risk is 4 Dax points - [stop loss level (5129) minus entry level (5125)],
Reward/Risk ratio is 15.75 – (63 divided by 4) – an excellent value.
Conclusion – the R/R ratio being excellent, we will place our three pre-arranged orders.
The second bar of the opening just retraced, slightly over the upper median line, thus executing the entry order (Figure n° 5). The third opening bar (last one on the chart) has its close in its lower quarter, hinting towards a down-sloping move. We are confident in our progressing short-trade, mainly because of the breakout gap and the down-zooming huge bar.
The market has started to develop a pullback with regard to the down-move (refer to Figure 6). It is an excellent opportunity to add on (scale in) one trading unit. When adding, the trader should add on fewer units than the number of initial entry units. The standard value is 33% to a maximum of 50% of the number of the total entry units.
Therefore, we enter a pre-arranged add on unit sell stop order at 5125 level. The same stop loss (5129 level ) will be used, as that of the initial entry, targeting the same target n°1.
Therefore, we will have two trading units initially entered and a third one, as an add on, a total of three units. Two are exiting at target n°1 level, and the third at target n° 2 level. The enormous potential of this trade requires more than an intra-day trading session, so we have decided to let the trade in overnight.
As anticipated, the next day, the market dropped farther (refer to Figure 7) with a huge gap of 55.5 Dax points. Not only did the market price reach our target n° 1, but it exceeded it. At the opening of next day, we were still in the trade, in spite of the pre-arranged buy stop at 5062 (target n° 1). Thus, we had to manually exit with two units, right at the opening bar (5032 level). We also moved the stop of the remaining trading unit to the break-even level. We note that the occurrence of a second gap, usually called the running gap, gives another dimension to the already consistent trade potential.
The 50% level of the latter gap represents the half potential of the entire trend. The opening bar of the next day (refer to Figure 7) has a huge down tail, representing two thirds of the body. It only signals a short break in the strong down market drop. It looks like the target n°2 has a great probability to be attained. This would be the moment to add on (scale in) another trading unit, because of the high probability trade outcome.
The above chart illustrates the targeting out of our last unit (the third one) at 4990 level (target n°2) during the last hour of the day. Thus, our trade was terminated. We should emphasize here, the merit of the pre-arranged exits, especially the second one, which helped us to get the most out of this trade. Without this, we would have not been able to optimally manage the trade.
Profit & Loss – P/L Statement
Now, that the trade has been concluded let us see its outcome:
We have taken three trading units, all of them traded following an automatic pilot mode with pre-arranged orders, even if the market forced us, to exit manually. We should emphasize that all three units were governed by the three-pawn technique.
We have risked per contract four DAX points representing 100 euros ($127).
The reward per contract pertaining to the R/R ratio of 15.75, initially calculated per contract, was 63 Dax points. As we know, we have traded three units: two at the initial entry and one add on. Their exits were as follows: two units at 5032 level, and the last one at 4990 level.
Therefore, we have obtained the following results:
Firstly, for the two trading units, we have per contract a reward of 93 Dax points:
[entry level (5125) minus exit No 1 level (5032)],
Secondly, for the third trading unit, we have per contract a reward of 135 Dax points:
[entry level (5125) minus exit No 2 level (4990)],
The total financial result per contract (all three units) is 321 Dax points (2x93 + 1x135) a total of 8025 euros ($10191). The total time spent in the trade was two days, from the second hourly bar of the first day to the last bar of the next day.
Trader’s Journal - Keep Your Records
We write in the journal the main topics and also the unusual events or missing opportunities due to either the respect of the rules, or to the occurrence of new lessons pertaining to the learning curve.
Let us proceed further:
We fully respected the rules, especially the three pawn technique rules.
The trade reward is excellent, above the average results.
We have comfortably detected the first add on opportunity which we traded and also the second one below 5032 level, right at the opening of the second bar of the second day. We chose not to trade the latter because of the large required stop loss.
Once again, we realized the importance of identifying the types of gaps and their relationship with:
The median line and its contextual pitchfork acolytes,
Money management of the trade.
We took note of the role of the scanning of all five times frames, in order to reveal a low-risk high-probability trade, thus giving us an increased confidence in our tools and techniques. This is one of the best remedies for treating and healing the trigger-shy syndrome.
We noticed also the role of the failures, their detection and also the best way to trade them. Their concomitant occurrence in the already mentioned multiple times frames enhances, several times, the classic trade potential. Always look for them… they are great money-makers!