For years, market aficionados and forex traders alike have been using simple price patterns not only to forecast profitable trading opportunities but also to explain simple market dynamics. As a result, common formations such as pennants flags and double bottoms and tops are often used in the currency markets, as well as many other trading markets. A less talked about, but equally useful, pattern that occurs in the currency markets is the bearish diamond top formation, commonly known as the diamond top. In this article, we'll explain how forex traders can quickly identify diamond tops in order to capitalize on various opportunities.
The diamond top occurs mostly at the top of considerable uptrends. It effectively signals impending shortfalls and retracements with relative accuracy and ease. Because of the increased liquidity of the currency market, this formation can be easier to identify in the currency market than in its equity-based counterpart, where gaps in price action frequently occur, displacing some of the requirements needed to recognize the diamond top. This formation can also be applied to any time frame, especially daily and hourly charts, as the wide swings often seen in the currency markets will offer traders plenty of opportunities to trade.
Identifying and Trading the Formation
The diamond top formation is established by first isolating an off-center head and shoulders formation and applying trendlines dependent on the subsequent peaks and troughs. It gets its name from the fact that the pattern bears a striking resemblance to a four-sided diamond.
Let's look at a step-by-step breakdown of how to trade the formation, using the Australian dollar/U.S. dollar (AUD/USD) currency pair (Figure 1) as our example. First, we identify an off-center head and shoulders formation in a currency pair. Next, we draw resistance trendlines, first from the left shoulder to the head (line A) and then from the head to the right shoulder (line B). This forms the top of the formation; as a result, the price action should not break above the upper trendline resistance formed by the right shoulder. The idea is that the price action consolidates before the impending shortfall, and any penetrations above the trendline would ultimately make the pattern ineffective, as it would mean that a new peak has been created. As a result, the trader would be forced to consider either reapplying the trendline (line B) that runs from the head to the right shoulder, or disregarding the diamond top formation altogether, since the pattern has been broken.
To establish lower trendline support, the technician will simply eye the lowest trough established in the formation. Bottomside support can then be drawn by connecting the bottom tail to the left shoulder (line C) and then connecting another support trendline from the tail to the right shoulder (line D). This connects the bottom half to the top and completes the pattern. Notice how the rightmost angle of the formation also resembles the apex of a symmetrical triangle pattern and is suggestive of a breakout.
Figure 1 - Identifying a diamond top formation using the AUD/USD.
Trading the diamond top isn't much harder than trading other formations. Here, the trader is simply looking for a break of the lower support line, suggesting increasing momentum for a probable shortfall. The theory is quite simple. Both upper resistance and lower support levels established by the right shoulder will contain the price action as each subsequent session's range diminishes, suggestive of a near-term breakout. Once a session closes below the support level, this indicates that selling momentum will continue because sellers have finally pushed the close below this significant mark. The trader will then want to place his/her entry shortly below this level to capture the subsequent decline in the price. This approach works especially well in the currency markets, where price action tends to be more fluid and trends are established more quickly once a certain significant support or resistance level is broken. Money management would be applied to this position through a stop-loss placed slightly above the previously broken support level to minimize any losses that might occur if the break is false and a temporary retracement takes place.
Figure 2 below shows a zoomed in view of Figure 1. We can see that a session candle closed below or "broke" the support trendline (line D.i.), indicating a move lower. The diamond top trader would profit from this by placing an entry order below the close of the support line at 0.7504, while also placing a stop-loss slightly above the same line to minimize any potential losses should the price bounce back above. The standard stop will be placed 50 pips higher at 0.7554. In our example, the stop order would not have been executed because the price did not bounce back, instead falling 150 pips lower in one session before falling even further later on.
Figure 2 below shows a zoomed in view of Figure 1. We can see that a session candle closed below or "broke" the support trendline (line D.i.), indicating a move lower. The diamond top trader would profit from this by placing an entry order below the close of the support line at 0.7504, while also placing a stop-loss slightly above the same line to minimize any potential losses should the price bounce back above. The standard stop will be placed 50 pips higher at 0.7554. In our example, the stop order would not have been executed because the price did not bounce back, instead falling 150 pips lower in one session before falling even further later on.
Figure 2 - A closer look at the diamond top formation using the AUD/USD. Notice how the position of the entry is just below the support line (D.i.).
Finally, profit targets are calculated by taking the width of the formation from the head of the formation (the highest price) to the bottom of the tail (the lowest price). Staying with our example using the AUD/USD currency pair, Figure 3 shows how this would be done. In Figure 3, the AUD/USD exchange rate at the top of the formation is 0.8003. The bottom of the diamond top is exactly 0.7250. This leaves 753 pips between the two prices that we use to form the maximum price where we can take profits. To be safe, the trader will set two targets in which to take profits. The first target will require taking the full amount, 753 pips, and taking half that amount and subtracting it from our entry price. Then, the first target will be 0.7128. The price target that will maximize our profits will be 0.6751, calculated by subtracting the full 753 pips from the entry price.
Figure 3 - The price target is calculated on the same example of the AUD/USD
Using a Price Oscillator Helps
One of the cardinal rules of successful trading is to always receive confirmation, and the diamond top pattern is no different. Adding a price oscillator such as moving average convergence divergence and the relative strength index can increase the accuracy of your trade, since tools like these can gauge price action momentum and be used to confirm the break of support or resistance. Applying the stochastic oscillator to our example (Figure 4), the investor confirms the break below support through the downward cross that occurs in the price oscillator (point X).
Figure 4 - The cross of the stochastic momentum indicator (point X) is used to confirm the downward move.
Putting It All Together
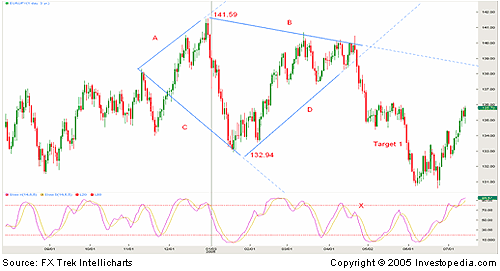
Not only do bearish diamond tops form in the major currency pairs like the Euro/U.S. dollar (EUR/USD), the British pound/U.S. dollar (GBP/USD) and the U.S. dollar/Japanese yen (USD/JPY), but they also form in lesser-known cross-currency pairs such as the Euro/Japanese yen (EUR/JPY). Although the formation occurs less in the cross-currency pairs, the swings tend to last longer, creating more profits. Let's look at a step-by-step example of this using the EUR/JPY:
1) Identify the head and shoulders pattern and confirm the offset nature of the formation by noticing that the head is slightly to the left, while the tail is set to the right.
2) Form the top resistance by connecting the left shoulder to the tip top of the head (line A) and the head to the right shoulder (line B). Next, draw the trendlines for support by connecting the left shoulder (line C) to the tail and the tail to the right shoulder (line D).
3) Calculate the width of the formation by taking the prices at the top of the head, 141.59, and the bottom of the tail, 132.94. This will give us a total of 865 pips of distance before we can take our full profits. Divide by two and our first point to take profits will be 432 pips below our entry.
4) Establish the entry point. Look to the apex of the right shoulder and notice the point where the candle closes below the support line, breaking through. Here, the close of the session is 137.79. The entry order should then be placed 50 pips below at 137.29, while our stop-loss order will be placed 50 pips above at 137.79.
5) Calculate the first take profit price by subtracting 432 pips from the entry. As a result, the first profit target will be at 133.45.
6) Finally, confirm the trade by using a price oscillator. Here, the stochastic oscillator signals ahead and confirms the opportunity as it breaks below overbought levels (point X).
If the first target is achieved, the trader will move his/her stop up to the first target, then place a trailing stop to protect any further profits.
Figure 5 - A different example of a diamond top formation using the EUR/JPY cross-currency pair. This chart shows all the trendlines, the highest and the lowest price, and the price target.
Conclusion
Although the bearish diamond top has been overlooked due to its infrequency, it remains very effective in displaying potential opportunities in the forex market. Smoother price action due to the enormous liquidity of the market offers traders a better context in which to apply this method and isolate better opportunities. When this formation is combined with a price oscillator, the trade becomes an even better catch - the price oscillator enhances the overall likelihood of a profitable trade by gauging price momentum and confirming weakness as well as weeding out false breakout/breakdown trades.
Richard Lee is a currency strategist at Forex Capital Markets LLC. Employing both fundamental models and technical analysis applications, Richard contributes regularly to DailyFX and Bloomberg. He has extensive experience in trading the spot currency markets, options and futures. Before joining the research group, Richard traded FX, equity and equity derivatives for a private equity consortium. Richard graduated from Pennsylvania State University with a Bachelor of Arts in economics and a Bachelor of Science in French with an emphasis in international business.


